
Understanding complex interactions between business functions in an application can be a challenge. Traditional methods like UML diagrams might not provide the necessary clarity, especially when dealing with intricate message flows.
From UML to Interactive Visualization: The Challenge
Analyzing and visualizing the message flow between business functions was the goal of my current project. At first, we considered using a UML tool for this job, but we came to the conclusion that it might not be as flexible as we need it to be. Finally, I’ve got the assignment to create a custom web application.
Since business functions and messages are related to each other, it made sense to represent them as a graph. That’s why I chose Neo4j as the database. Now the question was how to manage and visualize the graph. As I’m experienced with the Vaadin framework I want to use it also in this project.
Vaadin has a lot of great UI components but in my case, there was no match. Finally, I’ve found vis.js. The network diagram seemed appropriate for the visualization. Luckily Vaadin provides the Vaadin Directory, a place to publish 3rd party components. From the Vaadin directory, a component called vis-network-vaadin is available that provides a Java API on top of vis.js
The Graph
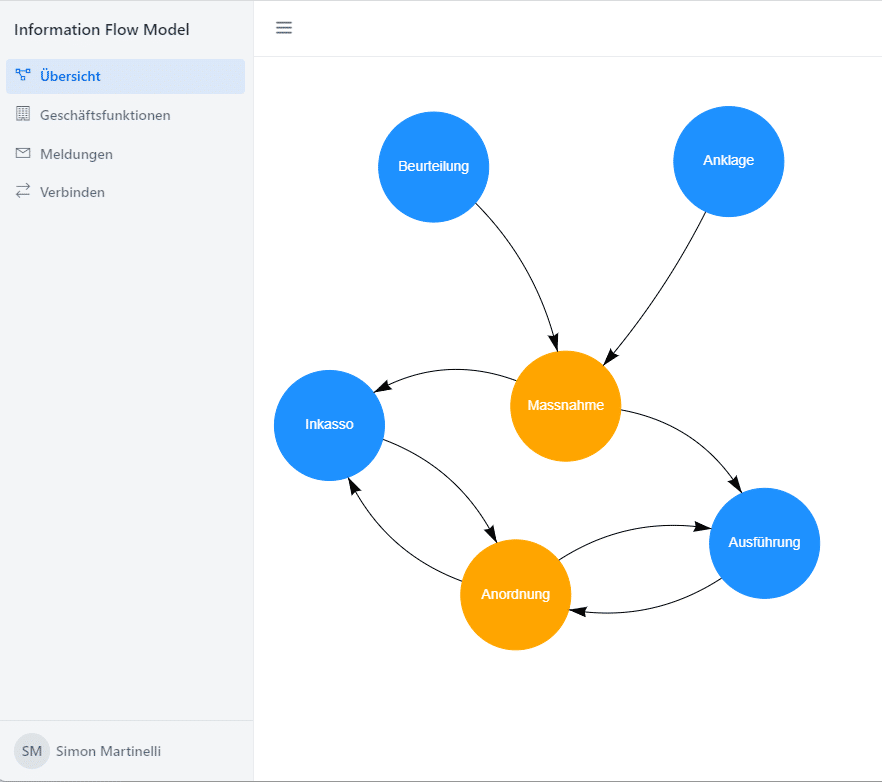
The graph below is a simplified model of what my client wants to manged in the application. A business function can send many messages and a message can be received by many business functions.

Building the Vaadin Application: Setting Up and Dependencies
First I created a Vaadin project on start.vaadin.com and added the vis-network-vaadin dependency for the visualization. As Vaadin uses Spring Boot by default I could just add spring-boot-starter-data-neo4j for the data access.
Data Access with Spring Data Neo4j
Spring Data Neo4j provides easy access to Neo4j. As I already know Spring Data JPA and the programming model are very similar it was easy to get started. First I’ve mapped the nodes and defined the relationships using the Neo4j annotations.
@Node
public class BusinessFunction {

    @Id
    @GeneratedValue
    private Long id;

    private String nameDE;
    private String actorsDE;
    private String descriptionDE;
}
@Node
public class Message {

    @Id
    @GeneratedValue
    private Long id;

    private String nameDE;
    private String descriptionDE;

    @Relationship(type = "SENDS", direction = Relationship.Direction.INCOMING)
    private Set<BusinessFunction> senders = new HashSet<>();

    @Relationship(type = "RECEIVES")
    private Set<BusinessFunction> receivers = new HashSet<>();
}
To read and write the data you can use repositories and make use of interface methods that will be used to generate the queries for you. Remark: I didn’t care about the performance so the generated queries were good enough in the first phase.
public interface BusinessFunctionRepository extends Neo4jRepository<BusinessFunction, Long> {

    Optional<BusinessFunction> findByNameDE(String name);

    List<BusinessFunction> findAllByNameDELike(String name, Pageable pageable);
}
public interface MessageRepository extends Neo4jRepository<Message, Long> {

    Optional<Message> findByNameDE(String name);

    List<Message> findAllByNameDELike(String name, Pageable pageable);
}
Creating the Interactive Visualization with vis-network-vaadin
Finally, I had to visualize the graph with a network diagram. Using the vis-network-vaadin API made it quite simple. I just had to map BusinessFunction and Message to nodes and create edges from the relationships.
var networkDiagram = new NetworkDiagram(Options.builder().build());
networkDiagram.setSizeFull();
var businessFunctionNodes = businessFunctionRepository.findAll().stream()
.map(businessFunction -> createNode("b-", businessFunction.getId(), businessFunction.getNameDE(), "DodgerBlue"))
.toList();
var nodes = new ArrayList<>(businessFunctionNodes);
var messages = messageRepository.findAll();
var messageNodes = messages.stream()
.map(message -> createNode("m-", message.getId(), message.getNameDE(), "Orange"))
.toList();
nodes.addAll(messageNodes);
var dataProvider = new ListDataProvider<>(nodes);
networkDiagram.setNodesDataProvider(dataProvider);
var edges = new ArrayList<Edge>();
for (Message message : messages) {
for (BusinessFunction sender : message.getSenders()) {
edges.add(createEdge("b-", sender.getId(), "m-" + message.getId().toString(), getTranslation("sends")));
}
for (BusinessFunction receiver : message.getReceivers()) {
edges.add(createEdge("m-", message.getId(), "b-" + receiver.getId(), getTranslation("receives")));
}
}
networkDiagram.setEdges(edges);
These are the helper methods to create nodes and edges:
private Edge createEdge(String prefix, Long id, String name, String label) {
    var edge = new Edge(prefix + id.toString(), name);
    edge.setColor("black");
    edge.setArrows(new Arrows(new ArrowHead(1, Arrows.Type.arrow)));
    edge.setLength(300);
    return edge;
}

private Node createNode(String prefix, Long id, String name, String color) {
    var node = new Node(prefix + id, name);
    node.setShape(Shape.circle);
    node.setColor(color);
    node.setFont(Font.builder().withColor("white").build());
    node.setWidthConstraint(new WidthConstraint(100, 100));
    return node;
}
Finally, the graph is displayed in the application.
Conclusion: A Powerful Approach for Message Flow Visualization
The application is still in an early stage. The graph will be extended and the diagram must be improved. Especially the behavior when dragging around the edges seems to be quite tricky and vis.js provides a lot of configuration.
As a Java developer creating UIs with Vaadin makes it very efficient. There are even 3rd party libraries that wrap components in a Java API. On the other side, I was impressed by how easy it is to start with Neo4j and to integrate it into a Spring Boot application.
Btw. If you want to learn more about Spring Boot check my video below.